
You can use the Noptin dashboard to review subscriber growth and campaign activity for a selected period. The reports help you see what changed and when, but they only include activity that Noptin was able to record.
Choose the reporting period
- Open Noptin → Dashboard.
- Select a Start Date and End Date.
- Use Group By to choose how the chart divides the period.
- Click Apply.
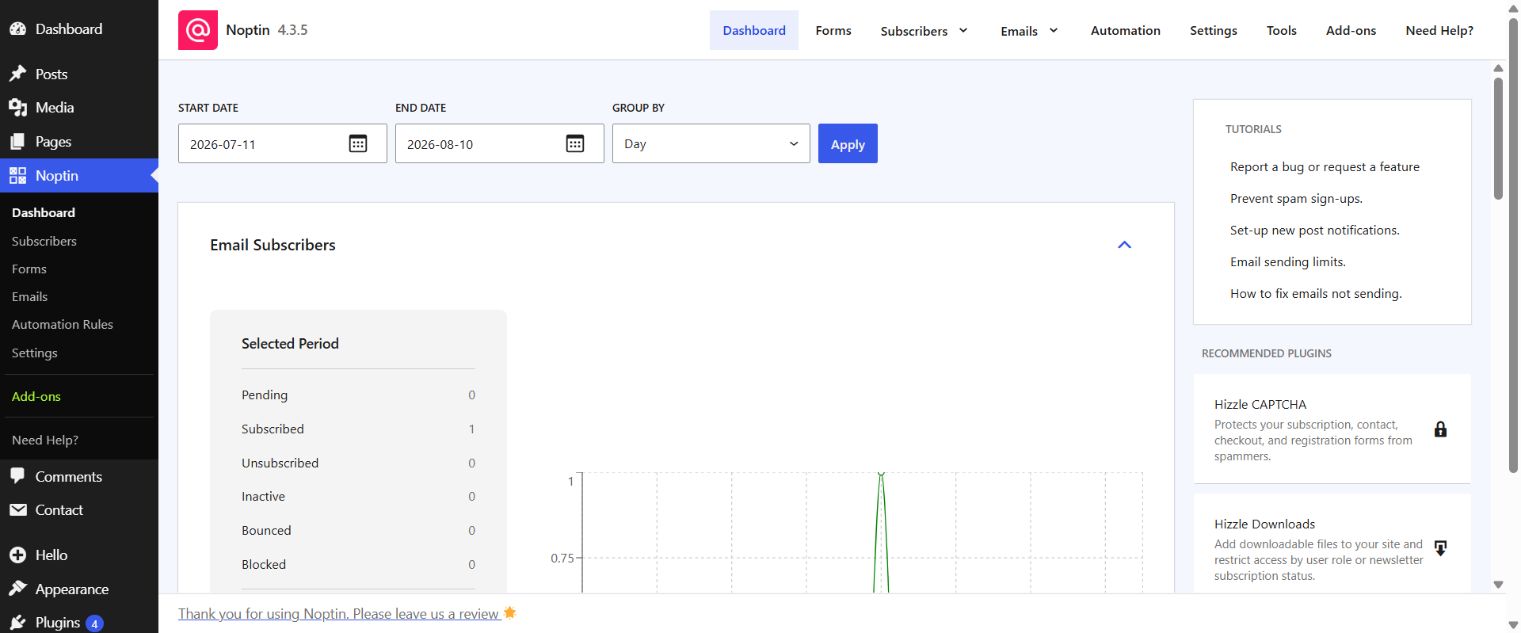
The date controls affect the dashboard reports below them. If a chart appears empty, confirm that the selected period includes dates when the corresponding activity occurred.
Read the dashboard reports
| Report | What it shows | Important limitation |
|---|---|---|
| Email Subscribers | Changes in pending, subscribed, unsubscribed, inactive, bounced, and blocked subscriber totals during the selected period. | The chart reflects subscriber events recorded in that period, not every historical subscriber. |
| Email Campaigns | Recorded campaign activity such as opens and clicks. | Privacy features, image blocking, and link-tracking settings can affect the recorded totals. |
| Recent Activity | The most recently recorded individual events. | It is an event log, not a count of unique subscribers. |
Interpret engagement totals carefully
- An open can be recorded when the tracking image loads; image blocking can prevent a genuine open from appearing.
- Privacy features can preload tracking images and produce opens that do not represent deliberate reading.
- A click is recorded only for links that Noptin can track.
- Purchase or revenue information is available only when the relevant integration supplies that data.
When you need to inspect the people behind a campaign total, follow Viewing People Who Have Opened or Clicked an Email.
Leave a Reply